

Turkmenistan
ECON COMPLEXITY (2018)
-0.68
RANK 100 OF 137
PRODUCT EXPORTS (2018)
$9.11B
RANK 91 OF 222
EXPORTS PER CAPITA (2018)
$1.56K
RANK 83 OF 219
PRODUCT IMPORTS (2018)
$2.38B
RANK 152 OF 221
IMPORTS PER CAPITA (2018)
$406
RANK 99 of 219
GDP (2018)
$40.8B
CURRENT US$
RANK 93 OF 196
GDP GROWTH (2008-2018)
112%
CURRENT US$
RANK 25 OF 196
GDP PC (2018)
$6,967
CURRENT US$
RANK 94 OF 196
GDP PC GROWTH (2008-2018)
78.4%
CURRENT US$
RANK 25 OF 196
Overview: This page contains the latest international trade data for Turkmenistan, and tariffs. In 2018 Turkmenistan was the number 93 economy in the world in terms of GDP (current US$), the number 91 in total exports, the number 152 in total imports, and the number 100 most complex economy according to the Economic Complexity Index (ECI). In 2018, Turkmenistan exported $9.11B and imported $2.38B, resulting in a positive trade balance of $6.73B. In 2018, Turkmenistan’s exports per capita were $1.56k and its imports per capita were $406.
Trade: The top exports of Turkmenistan are Petroleum Gas ($7.23B), Refined Petroleum ($804M), Peat ($178M), Non-Retail Pure Cotton Yarn($159M), and Raw Cotton ($109M). The top imports of Turkmenistan are Harvesting Machinery ($98.8M), Special Purpose Ships ($89.3M), Packaged Medicaments ($72.8M), Steam Turbines ($63M), and Iron Pipes ($57.7M).
Destinations: Turkmenistan exports mostly to China ($7.3B), Afghanistan ($323M), Turkey ($256M), Uzbekistan ($228M), and Georgia($174M), and imports mostly from Turkey ($467M), China ($317M), Russia ($288M), United Arab Emirates ($258M), and Germany ($172M).
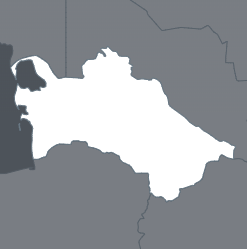
Location: Turkmenistan borders Afghanistan, Iran, Kazakhstan, and Uzbekistan by land and Azerbaijan by sea.
Exports
In 2018 Turkmenistan exported a total of $9.11B, making it the number 91 exporter in the world. During the last five reported years the exports of Turkmenistan have changed by -$1.31B from $10.4B in 2013 to $9.11B in 2018.
The most recent exports are led by Petroleum Gas ($7.23B), Refined Petroleum ($804M), Peat ($178M), Non-Retail Pure Cotton Yarn ($159M), and Raw Cotton ($109M).
Imports
In 2018 Turkmenistan imported $2.38B, making it the number 152 trade destination in the world. During the last five reported years the imports of Turkmenistan changed by -$4.94B from $7.31B in 2013 to $2.38B in 2018.
The most recent imports of Turkmenistan are led by Harvesting Machinery ($98.8M), Special Purpose Ships ($89.3M), Packaged Medicaments ($72.8M), Steam Turbines ($63M), and Iron Pipes ($57.7M).
Trade Balance
As of 2018 Turkmenistan had a positive trade balance of $3.75B in net exports. As compared to their trade balance in 1995 when they still had a positive trade balance of $171M in net exports.
Destinations
The most common destination for the exports of Turkmenistan are China ($7.3B), Afghanistan ($323M), Turkey ($256M), Uzbekistan ($228M), and Georgia ($174M).
Origins
The most common import partners for Turkmenistan are Turkey ($467M), China ($317M), Russia ($288M), United Arab Emirates ($258M), and Germany ($172M).