
Bhutan
PRODUCT EXPORTS (2018)
$262M
RANK 170 OF 222
EXPORTS PER CAPITA (2018)
$347
RANK 98 OF 219
PRODUCT IMPORTS (2018)
$755M
RANK 179 OF 221
IMPORTS PER CAPITA (2018)
$1K
RANK 92 of 219
SERVICE EXPORTS (2017)
$164M
RANK 125 OF 139
SERVICE IMPORTS (2017)
$170M
RANK 128 OF 139
GDP (2018)
$2.45B
CURRENT US$
RANK 169 OF 196
GDP GROWTH (2008-2018)
99.3%
CURRENT US$
RANK 31 OF 196
GDP PC (2018)
$3,243
CURRENT US$
RANK 132 OF 196
GDP PC GROWTH (2008-2018)
77.4%
CURRENT US$
RANK 26 OF 196
Overview: In 2018 Bhutan was the number 169 economy in the world in terms of GDP (current US$), the number 170 in total exports, and the number 179 in total imports. In 2018, Bhutan exported $262M and imported $755M, resulting in a negative trade balance of -$493M. In 2018, Bhutan’s exports per capita were $347 and its imports per capita were $1k.
Trade: The top exports of Bhutan are Ferroalloys ($161M), Semi-Finished Iron ($21.1M), Dolomite ($19.8M), Carbides ($14.4M), and Planes, Helicopters, and/or Spacecraft ($8.23M). The top imports of Bhutan are Refined Petroleum ($119M), Delivery Trucks ($54.6M), Iron Reductions ($36.1M), Cars ($31.2M), and Light Synthetic Cotton Fabrics($21M).
Destinations: Bhutan exports mostly to India ($217M), Italy ($9.92M), Germany ($8.3M), United Kingdom ($8.25M), and France ($3.48M), and imports mostly from India ($651M), Thailand ($39M), China ($12.8M), United Arab Emirates ($9.58M), and Japan ($8.64M).
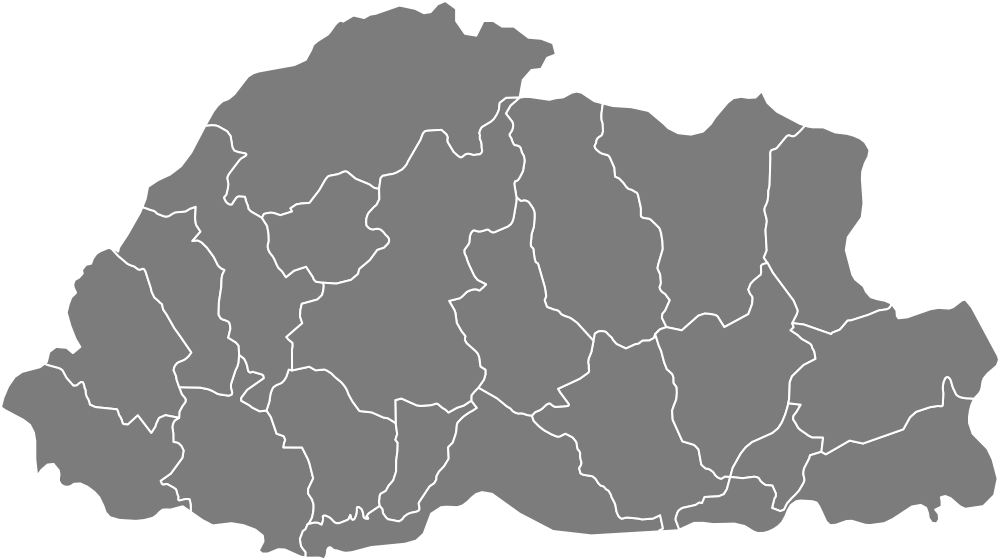
Location: Bhutan borders China and India by land.
Exports
In 2018 Bhutan exported a total of $262M, making it the number 170 exporter in the world. During the last five reported years the exports of Bhutan have changed by $112M from $150M in 2013 to $262M in 2018.
The most recent exports are led by Ferroalloys ($161M), Semi-Finished Iron ($21.1M), Dolomite ($19.8M), Carbides ($14.4M), and Planes, Helicopters, and/or Spacecraft ($8.23M).
Imports
In 2018 Bhutan imported $755M, making it the number 179 trade destination in the world. During the last five reported years the imports of Bhutan changed by $500M from $255M in 2013 to $755M in 2018.
The most recent imports of Bhutan are led by Refined Petroleum ($119M), Delivery Trucks ($54.6M), Iron Reductions ($36.1M), Cars ($31.2M), and Light Synthetic Cotton Fabrics ($21M).
Trade Balance
As of 2018 Bhutan had a negative trade balance of $288M in net imports. As compared to their trade balance in 1995 when they had a positive trade balance of $345k in net exports.
Destinations
The most common destination for the exports of Bhutan are India ($217M), Italy ($9.92M), Germany ($8.3M), United Kingdom ($8.25M), and France ($3.48M).
Origins
The most common import partners for Bhutan are India ($651M), Thailand ($39M), China ($12.8M), United Arab Emirates ($9.58M), and Japan ($8.64M).