
Djibouti
PRODUCT EXPORTS (2018)
$97.8M
RANK 190 OF 222
EXPORTS PER CAPITA (2018)
$102
RANK 39 OF 219
PRODUCT IMPORTS (2018)
$5.5B
RANK 129 OF 221
IMPORTS PER CAPITA (2018)
$5.74K
RANK 3 of 219
SERVICE EXPORTS (2017)
$418M
RANK 121 OF 139
SERVICE IMPORTS (2017)
$214M
RANK 132 OF 139
GDP (2018)
$2.96B
CURRENT US$
RANK 166 OF 196
GDP GROWTH (2008-2018)
196%
CURRENT US$
RANK 7 OF 196
GDP PC (2018)
$3,083
CURRENT US$
RANK 139 OF 196
GDP PC GROWTH (2008-2018)
152%
CURRENT US$
RANK 5 OF 196
Overview: In 2018 Djibouti was the number 166 economy in the world in terms of GDP (current US$), the number 190 in total exports, and the number 129 in total imports. In 2018, Djibouti exported $97.8M and imported $5.5B, resulting in a negative trade balance of -$5.4B. In 2018, Djibouti’s exports per capita were $102 and its imports per capita were $5.74k.
Trade: The top exports of Djibouti are Sheep and Goats ($27.1M), Other Animals ($19.3M), Coffee ($10.7M), Dried Legumes ($4.66M), and Soybeans ($3.88M). The top imports of Djibouti are Refined Petroleum($1.15B), Palm Oil ($334M), Raw Sugar ($191M), Coated Flat-Rolled Iron($147M), and Mixed Mineral or Chemical Fertilizers ($110M).
Destinations: Djibouti exports mostly to Saudi Arabia ($48.3M), India($11.1M), Nigeria ($6.45M), United Kingdom ($6.13M), and Netherlands($3.05M), and imports mostly from China ($1.87B), United Arab Emirates ($1.07B), India ($859M), Indonesia ($212M), and Malaysia($205M).
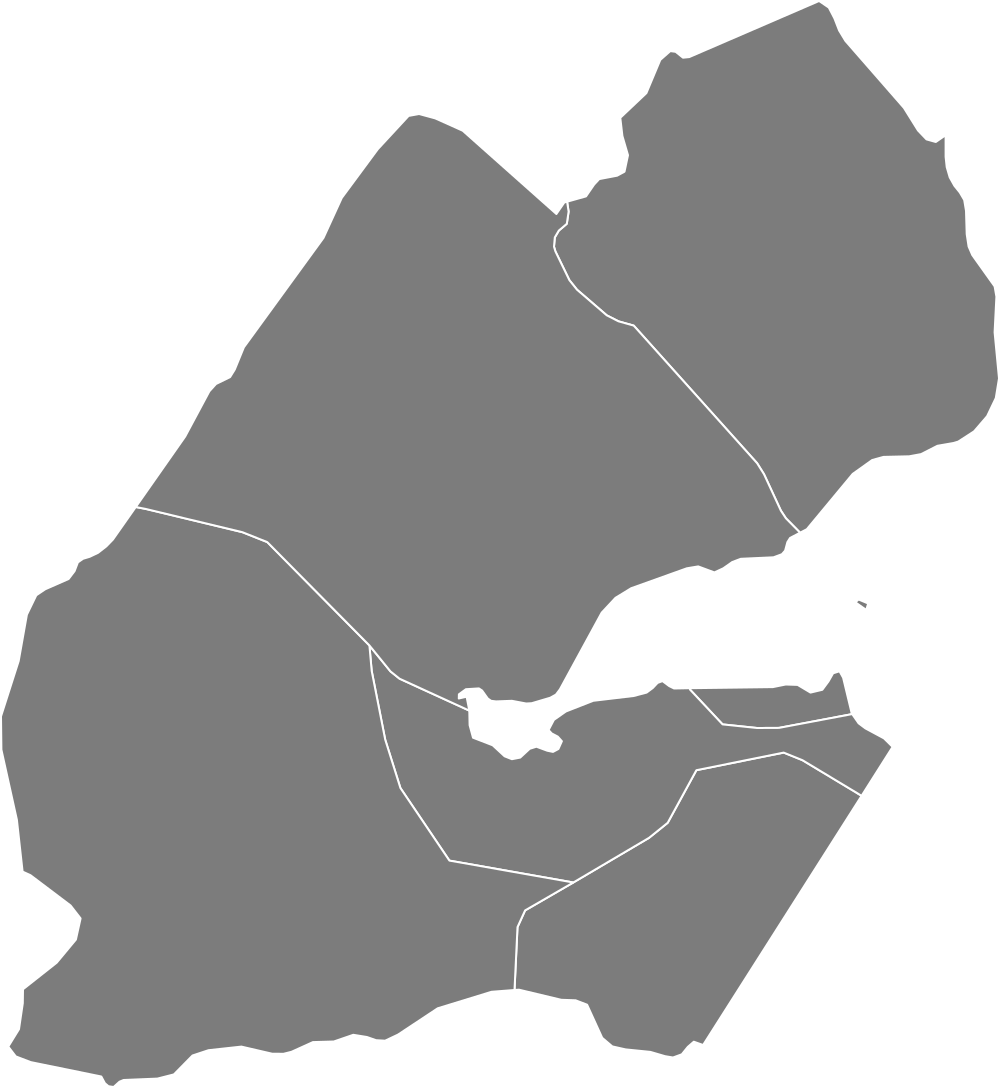
Location: Djibouti borders Eritrea, Ethiopia, and Somalia by land and Yemen by sea.
Exports
In 2018 Djibouti exported a total of $97.8M, making it the number 190 exporter in the world. During the last five reported years the exports of Djibouti have changed by $16.9M from $80.9M in 2013 to $97.8M in 2018.
The most recent exports are led by Sheep and Goats ($27.1M), Other Animals ($19.3M), Coffee ($10.7M), Dried Legumes ($4.66M), and Soybeans ($3.88M).
Imports
In 2018 Djibouti imported $5.5B, making it the number 129 trade destination in the world. During the last five reported years the imports of Djibouti changed by $2.76B from $2.74B in 2013 to $5.5B in 2018.
The most recent imports of Djibouti are led by Refined Petroleum ($1.15B), Palm Oil ($334M), Raw Sugar ($191M), Coated Flat-Rolled Iron ($147M), and Mixed Mineral or Chemical Fertilizers ($110M).
Trade Balance
As of 2018 Djibouti had a negative trade balance of $3.83B in net imports. As compared to their trade balance in 1995 when they still had a negative trade balance of $281M in net imports.
Destinations
The most common destination for the exports of Djibouti are Saudi Arabia ($48.3M), India ($11.1M), Nigeria ($6.45M), United Kingdom ($6.13M), and Netherlands ($3.05M).
Origins
The most common import partners for Djibouti are China ($1.87B), United Arab Emirates ($1.07B), India ($859M), Indonesia ($212M), and Malaysia ($205M).