
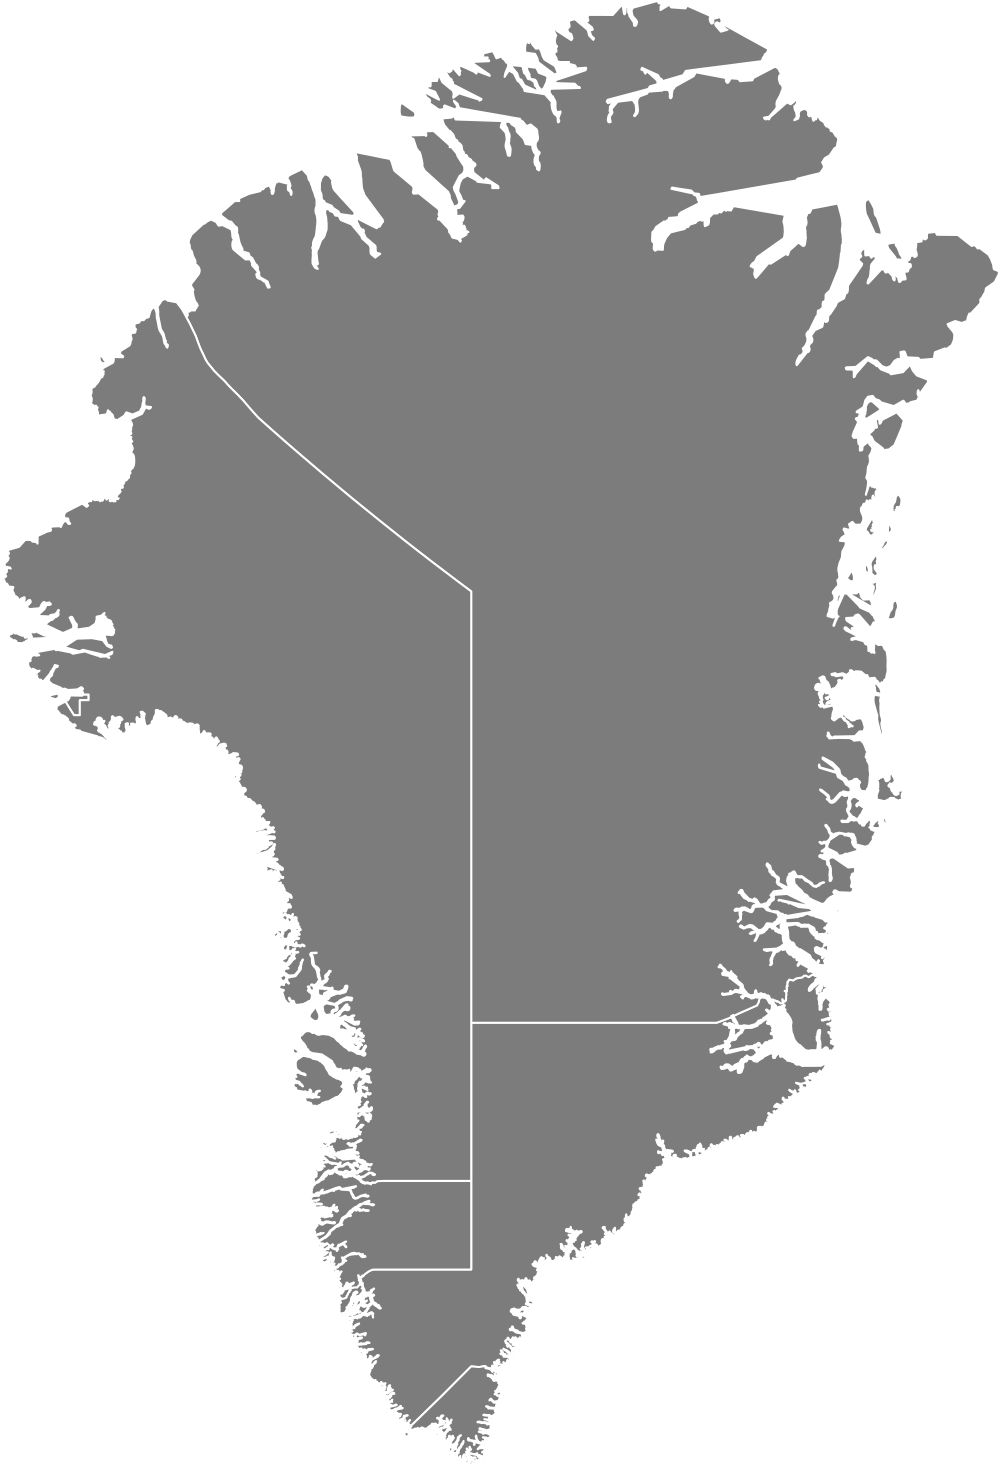

Greenland
PRODUCT EXPORTS (2018)
$1.11B
RANK 149 OF 222
EXPORTS PER CAPITA (2018)
$19.9
RANK 115 OF 219
PRODUCT IMPORTS (2018)
$884M
RANK 175 OF 221
IMPORTS PER CAPITA (2018)
$15.8K
RANK 157 of 219
SERVICE EXPORTS (2006)
$203M
RANK 164 OF 190
SERVICE IMPORTS (2006)
$315M
RANK 150 OF 188
Overview: This page contains the latest international trade data for Greenland, including service trade data. In 2018 Greenland was the number 149 in total exports and the number 175 in total imports. In 2018, Greenland exported $1.11B and imported $884M, resulting in a positive trade balance of $229M. In 2018, Greenland’s exports per capita were $19.9k and its imports per capita were $15.8k.
Trade: The top exports of Greenland are Non-fillet Frozen Fish($461M), Crustaceans ($354M), Processed Crustaceans ($147M), Fish Fillets ($82.5M), and Fishing Ships ($23.9M). The top imports of Greenland are Refined Petroleum ($169M), Fishing Ships ($91.4M), Aircraft Parts ($19.8M), Other Furniture ($13.8M), and Baked Goods($12.9M).
Destinations: Greenland exports mostly to Denmark ($550M), China($223M), Russia ($73.4M), Japan ($69.4M), and Norway ($43.5M), and imports mostly from Denmark ($431M), Sweden ($147M), Spain($95.3M), Germany ($27.4M), and Canada ($26.3M).
Location: Greenland borders Canada, Iceland, and Norway by sea.
Exports
In 2018 Greenland exported a total of $1.11B, making it the number 149 exporter in the world. During the last five reported years the exports of Greenland have changed by $332M from $781M in 2013 to $1.11B in 2018.
The most recent exports are led by Non-fillet Frozen Fish ($461M), Crustaceans ($354M), Processed Crustaceans ($147M), Fish Fillets ($82.5M), and Fishing Ships ($23.9M).
Imports
In 2018 Greenland imported $884M, making it the number 175 trade destination in the world. During the last five reported years the imports of Greenland changed by $12.2M from $872M in 2013 to $884M in 2018.
The most recent imports of Greenland are led by Refined Petroleum ($169M), Fishing Ships ($91.4M), Aircraft Parts ($19.8M), Other Furniture ($13.8M), and Baked Goods ($12.9M).
Trade Balance
As of 2018 Greenland had a positive trade balance of $228M in net exports. As compared to their trade balance in 1995 when they still had a positive trade balance of $90.8M in net exports.
Destinations
The most common destination for the exports of Greenland are Denmark ($550M), China ($223M), Russia ($73.4M), Japan ($69.4M), and Norway ($43.5M).
Origins
The most common import partners for Greenland are Denmark ($431M), Sweden ($147M), Spain ($95.3M), Germany ($27.4M), and Canada ($26.3M).