
Kazakhstan
ECON COMPLEXITY (2018)
-0.046
RANK 69 OF 137
PRODUCT EXPORTS (2018)
$64.1B
RANK 46 OF 222
EXPORTS PER CAPITA (2018)
$3.51K
RANK 73 OF 219
PRODUCT IMPORTS (2018)
$37.6B
RANK 61 OF 221
IMPORTS PER CAPITA (2018)
$2.06K
RANK 81 of 219
SERVICE EXPORTS (2018)
$7.2B
RANK 37 OF 88
SERVICE IMPORTS (2018)
$11.3B
RANK 31 OF 88
GDP (2018)
$179B
CURRENT US$
RANK 53 OF 196
GDP GROWTH (2008-2018)
34.4%
CURRENT US$
RANK 106 OF 196
GDP PC (2018)
$9,813
CURRENT US$
RANK 77 OF 196
GDP PC GROWTH (2008-2018)
15.3%
CURRENT US$
RANK 114 OF 196
Overview: In 2018 Kazakhstan was the number 53 economy in the world in terms of GDP (current US$), the number 46 in total exports, the number 61 in total imports, and the number 69 most complex economy according to the Economic Complexity Index (ECI). In 2018, Kazakhstan exported $64.1B and imported $37.6B, resulting in a positive trade balance of $26.5B. In 2018, Kazakhstan’s exports per capita were $3.51k and its imports per capita were $2.06k.
Trade: The top exports of Kazakhstan are Crude Petroleum ($38.3B), Petroleum Gas ($3.13B), Refined Copper ($2.8B), Ferroalloys ($2.26B), and Refined Petroleum ($1.83B). The top imports of Kazakhstan are Petroleum Gas ($1.05B), Refined Petroleum ($1.01B), Broadcasting Equipment ($883M), Packaged Medicaments ($871M), and Cars($701M).
Destinations: Kazakhstan exports mostly to Italy ($10.3B), China($6.41B), Netherlands ($6.04B), Russia ($5.28B), and France ($3.91B), and imports mostly from Russia ($13B), China ($8.71B), Germany($1.71B), Italy ($1.35B), and Uzbekistan ($1.22B).
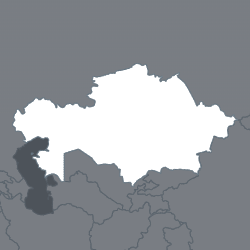
Location: Kazakhstan borders China, Kyrgyzstan, Russia, Turkmenistan, and Uzbekistan by land.
Exports
In 2018 Kazakhstan exported a total of $64.1B, making it the number 46 exporter in the world. During the last five reported years the exports of Kazakhstan have changed by -$10.1B from $74.2B in 2013 to $64.1B in 2018.
The most recent exports are led by Crude Petroleum ($38.3B), Petroleum Gas ($3.13B), Refined Copper ($2.8B), Ferroalloys ($2.26B), and Refined Petroleum ($1.83B).
Imports
In 2018 Kazakhstan imported $37.6B, making it the number 61 trade destination in the world. During the last five reported years the imports of Kazakhstan changed by -$12.2B from $49.8B in 2013 to $37.6B in 2018.
The most recent imports of Kazakhstan are led by Petroleum Gas ($1.05B), Refined Petroleum ($1.01B), Broadcasting Equipment ($883M), Packaged Medicaments ($871M), and Cars ($701M).
Trade Balance
As of 2018 Kazakhstan had a positive trade balance of $13.6B in net exports. As compared to their trade balance in 1995 when they still had a positive trade balance of $110M in net exports.
Destinations
The most common destination for the exports of Kazakhstan are Italy ($10.3B), China ($6.41B), Netherlands ($6.04B), Russia ($5.28B), and France ($3.91B).
Origins
The most common import partners for Kazakhstan are Russia ($13B), China ($8.71B), Germany ($1.71B), Italy ($1.35B), and Uzbekistan ($1.22B).